
For some people, a nine-to-five job is just a routine. For others, it feels almost out of reach. Across the United States, the way people work looks different depending on where they live. In some places, long hours and side jobs are the norm. In others, the pace is slower or shaped by limited job options.
These differences do not happen by chance. Local industries, cost of living, and even cultural expectations all play a part. A state built around farming, for example, runs on a totally different schedule than one driven by tech or finance. These patterns shape how people balance work, family, and rest.
To make sense of it, researchers look at more than just hours on the clock. They study things like employment rates, how many people work full-time in a household, and even how much free time people have. Volunteer work and leisure also help paint a clearer picture of how much energy people are putting into their daily lives.
One widely cited analysis comes from WalletHub, which ranks 50 states based on both direct and indirect work factors. It looks at ten key measures, all scored on a 100-point scale. A higher score means a heavier overall workload. The result is a clearer view of which states are pushing the hardest and which ones operate at a different pace. In the sections ahead, we will explore seven states working the hardest and seven working the least, and what sets them apart.
The Hardest Working- 1. North Dakota

Image Credit: Victoria Ditkovsky at Shutterstock.
North Dakota consistently ranks near the top for hardest working because it combines long working hours with strong participation in the labor force. Data shows that people here work more hours per week than the national average, and a noticeable portion of the population holds more than one job.
This pattern is closely tied to the state’s economic base, which leans heavily on oil production and agriculture. Both industries demand time, often in blocks that stretch well beyond standard schedules.
In smaller communities, it is also common for individuals to take on additional roles, either to supplement income or because fewer workers are available to share the load. This combination pushes both hours worked and participation rates higher.
2. Alaska
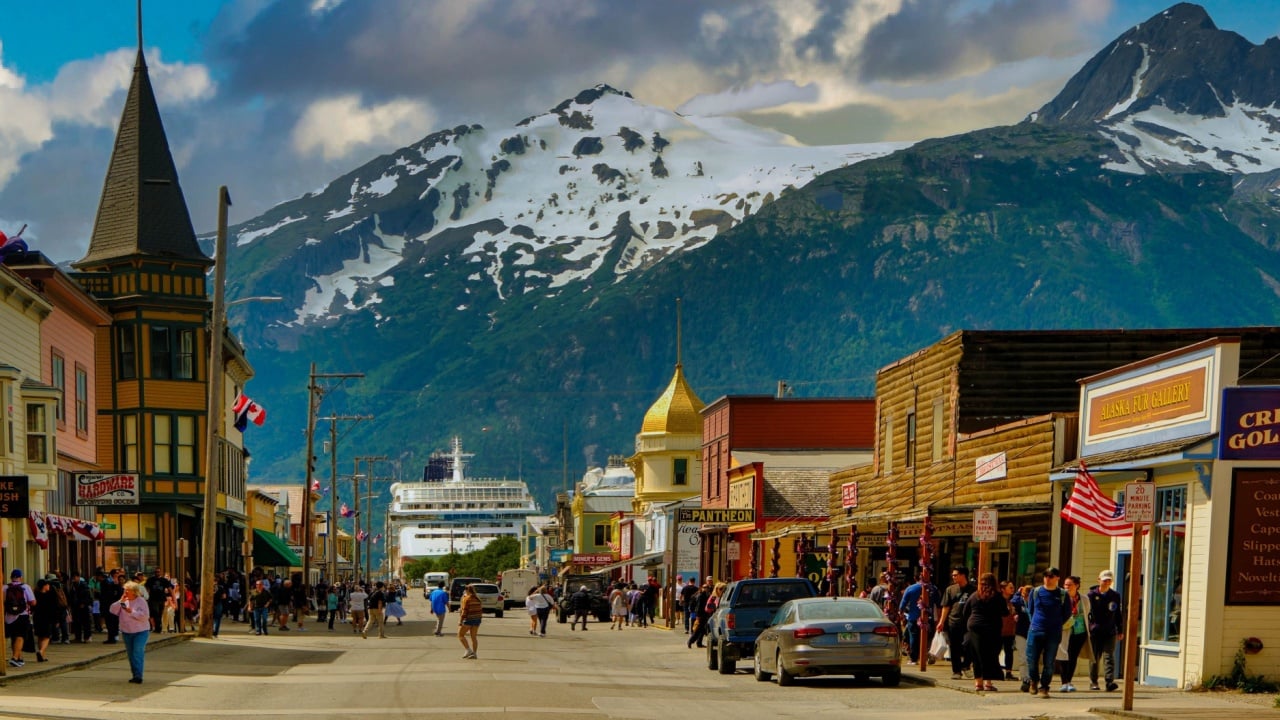
Image Credit: Darryl Brooks at Shutterstock.
Alaska shows a similar pattern, though shaped by its unique geography and seasonal economy. Workers often log long hours, and a higher-than-average share of people hold multiple jobs.
Industries such as fishing, oil, and tourism create cycles of intense activity, where long shifts are packed into specific times of the year.
Living conditions also play a role. In many parts of Alaska, job options are limited due to distance and isolation. This leads people to take on multiple roles or extend their hours when work is available. As a result, both participation and weekly hours trend upward compared to national averages.
3. South Dakota
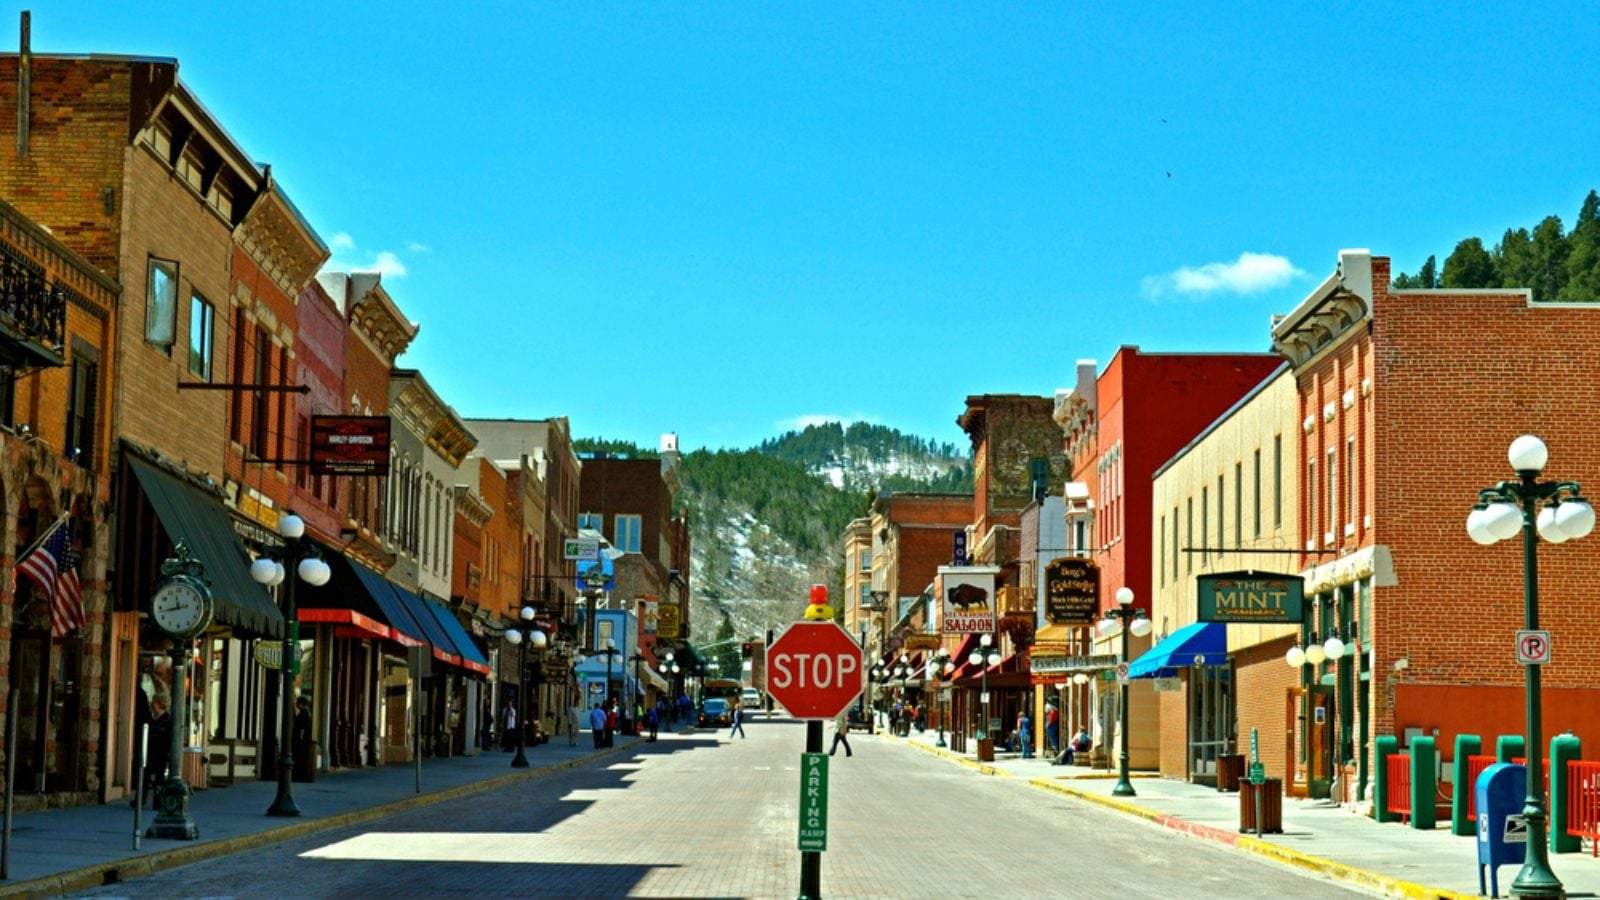
Image Credit: refocusphoto at Deposit Photos.
South Dakota’s position comes from a mix of high participation and long working hours, much of it tied to agriculture and small business activity. Farming remains central to the state’s economy, and it requires sustained effort during key parts of the year. Early mornings, late evenings, and physically demanding work are common.
Beyond agriculture, a large number of small and family-run businesses contribute to the workload. In these settings, employees and owners often handle multiple responsibilities, which naturally extends the workday.
There is less division of labor compared to larger corporate environments, so individuals tend to stay involved in many aspects of operations.
4. Nebraska
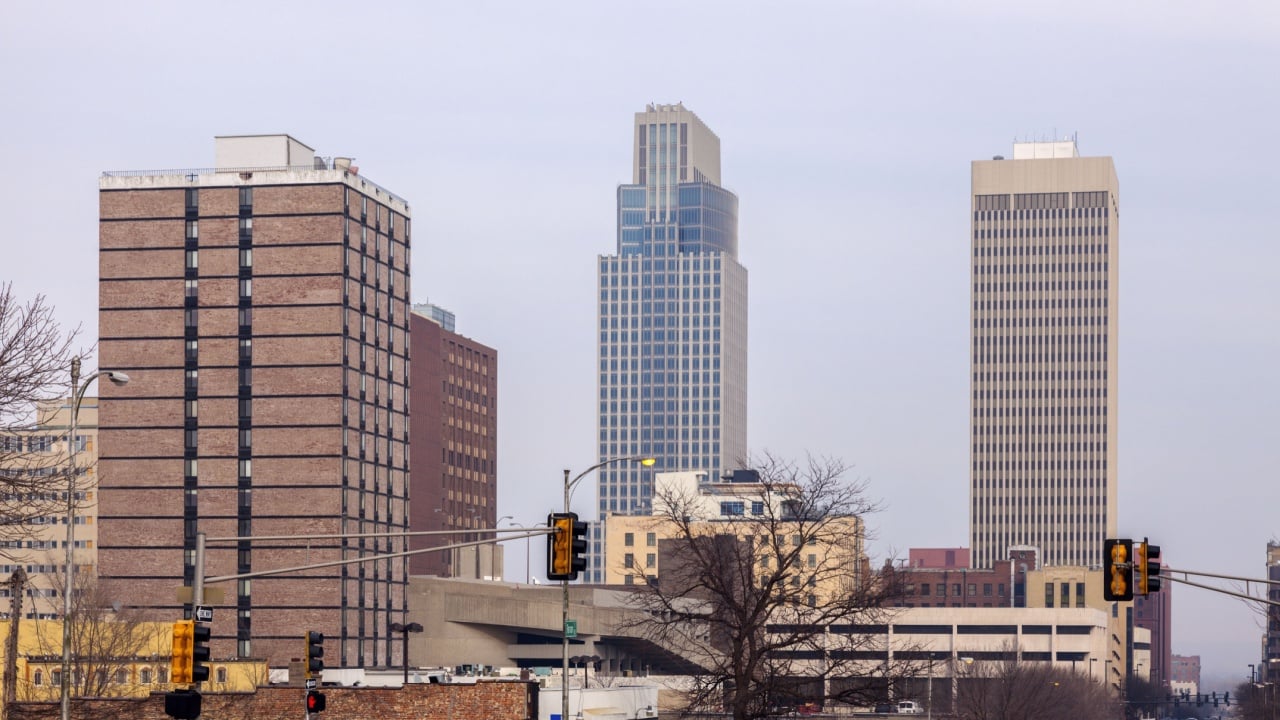
Image Credit: Shutterstock.
Nebraska stands out for its consistency. Employment levels remain stable, and workers tend to stay active in the labor force without large gaps. At the same time, average weekly hours are higher than usual, driven by industries like agriculture, transportation, and manufacturing.
The logistics sector is especially important. As a central hub for moving goods across the country, Nebraska supports continuous operations that often require extended or irregular shifts. Workers step in to meet that demand, taking on overtime or flexible schedules that raise total hours.
The result is a workforce that is both steady and heavily engaged. Jobs are available and relatively stable, but they often require a sustained level of effort that keeps Nebraska among the hardest-working states.
5. Texas
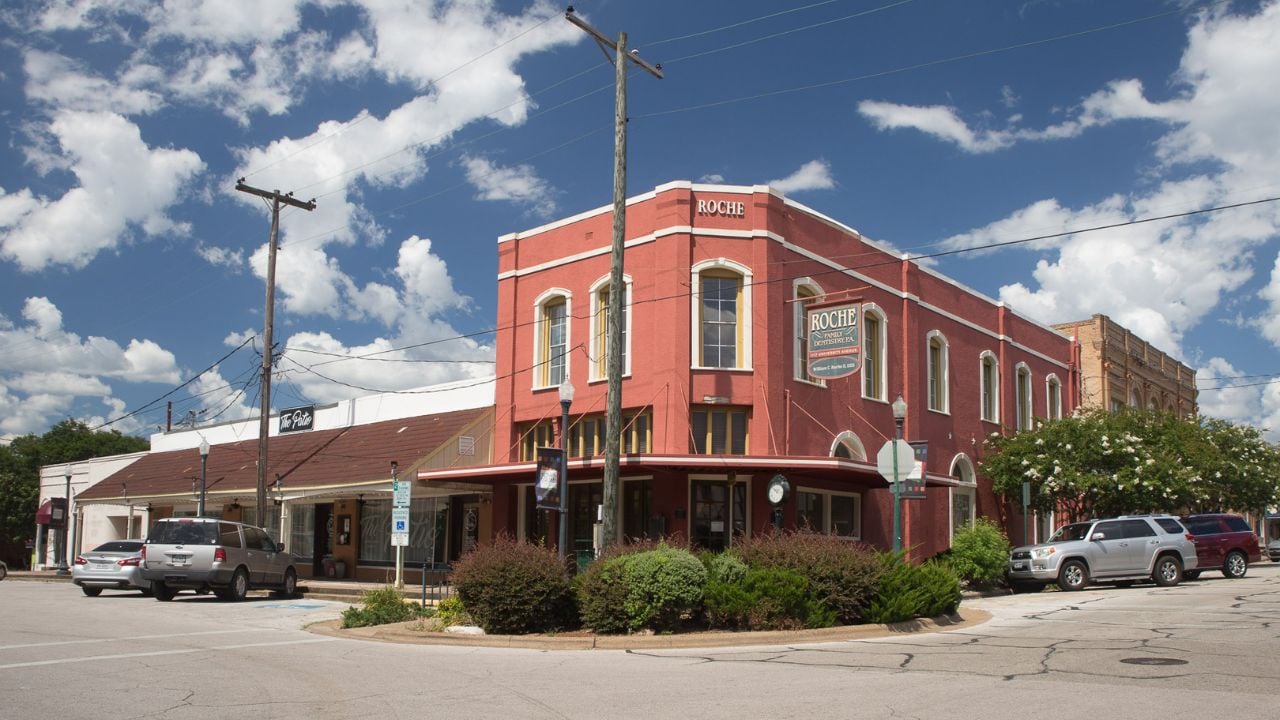
Image Credit: Renelibrary – Own work – CC BY-SA 4.0/Wiki Commons.
Texas earns its place through scale and momentum. It has one of the largest workforces in the country, with strong participation rates across multiple industries. Energy, construction, healthcare, and technology all contribute to long working hours, particularly in periods of growth.
Population expansion adds another layer. As more people move into the state, demand rises for housing, infrastructure, and services.
This creates additional pressure across industries, pushing workers to log longer hours to keep up. In sectors like construction and energy, extended schedules are already common, and growth only amplifies that.
6. Wyoming
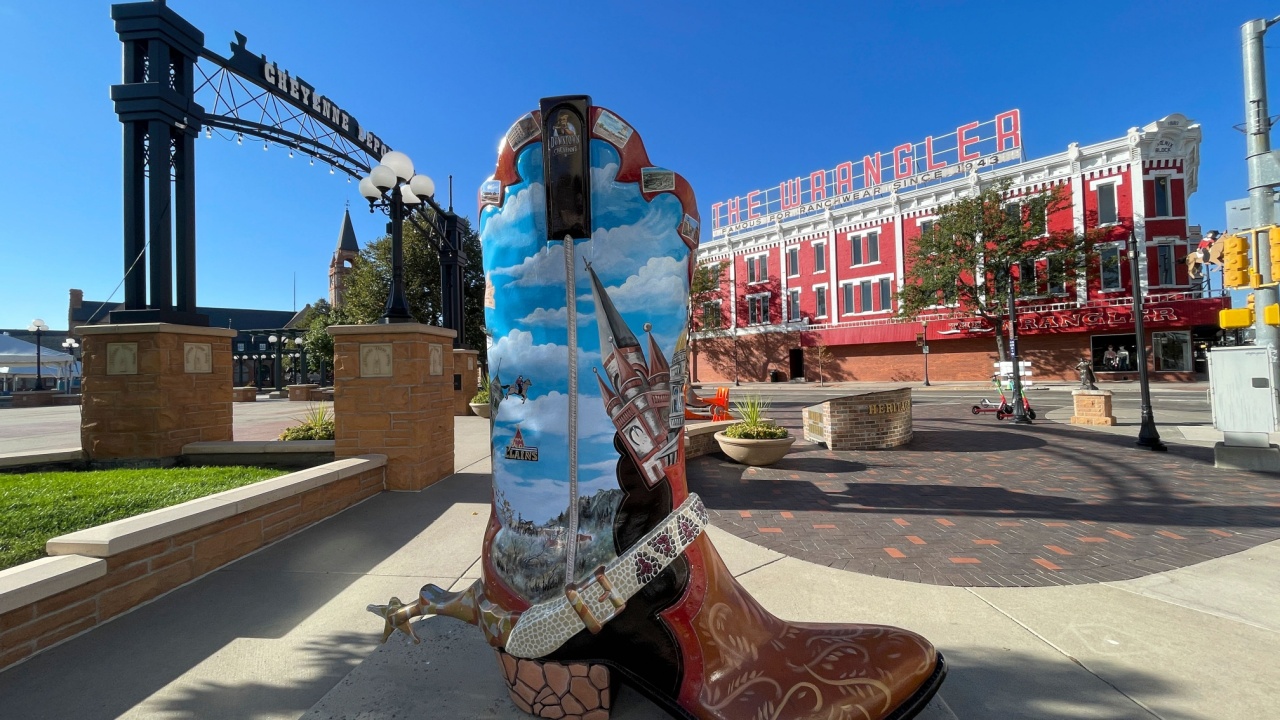
Image Credit: JSvideos at Shutterstock.
Wyoming’s ranking reflects a smaller workforce handling a large share of responsibility. Mining and energy production dominate the economy, and both involve long shifts and physically demanding conditions. Workers in these sectors often operate on schedules that extend well beyond typical workdays.
Population size plays a major role. With fewer people available to fill positions, those who are employed often take on broader roles or additional hours. This raises both individual workload and overall averages for the state.
The pattern is straightforward. In smaller states with concentrated industries, each worker carries more weight. That leads to higher output per person and longer working hours.
7. Kansas

Image Credit: Matt Fowler KC at Shutterstock.
Kansas maintains a steady position with strong labor participation and above-average working hours. Agriculture remains important, but manufacturing and aviation also contribute significantly to the workload. These industries require consistent effort and often involve extended production schedules.
Employment tends to be stable, with fewer fluctuations compared to other states. People remain active in the workforce, and jobs are spread across both rural and industrial sectors. This balance supports a consistent level of work activity.
What sets Kansas apart is this combination of stability and effort. Work is not concentrated in a single industry, yet the overall pace remains high due to steady demand across multiple sectors.
The Least Working- 1. West Virginia
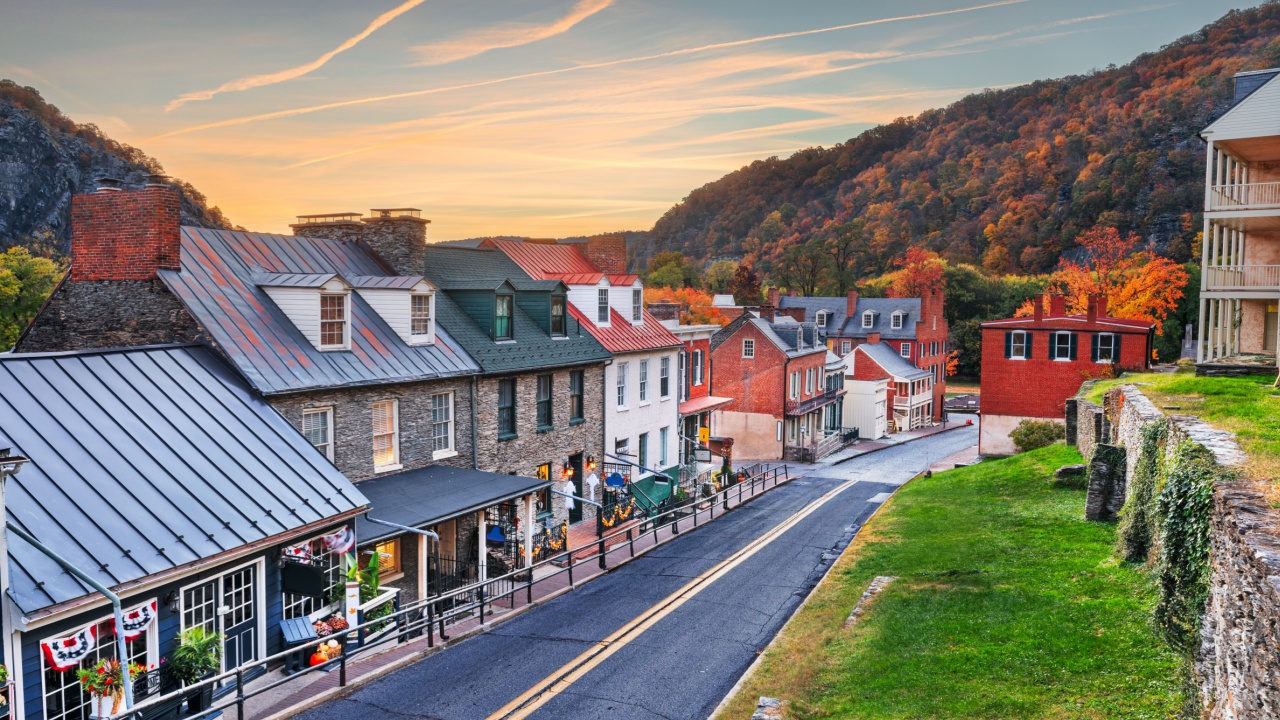
Image Credit: Shutterstock.
West Virginia ranks lower mainly due to reduced labor force participation. A significant portion of the population is older, and health challenges limit workforce involvement for many residents.
The decline of coal mining has also had a lasting impact. Jobs that once supported large parts of the state have not been fully replaced, leaving gaps in employment opportunities.
This combination of demographic and economic factors lowers overall work activity. When participation drops, the state’s ranking follows.
2. New Mexico

Image Credit: Deposit Photos.
New Mexico shows lower participation rates along with shorter average workweeks. Government and service sectors dominate, and many of these roles operate on fixed schedules with limited overtime.
There is also less industrial diversity compared to larger states. This restricts job options in certain regions, which affects both employment levels and hours worked.
The result is a slower overall pace of work. When fewer industries are driving demand, total labor activity tends to remain lower.
3. Arizona
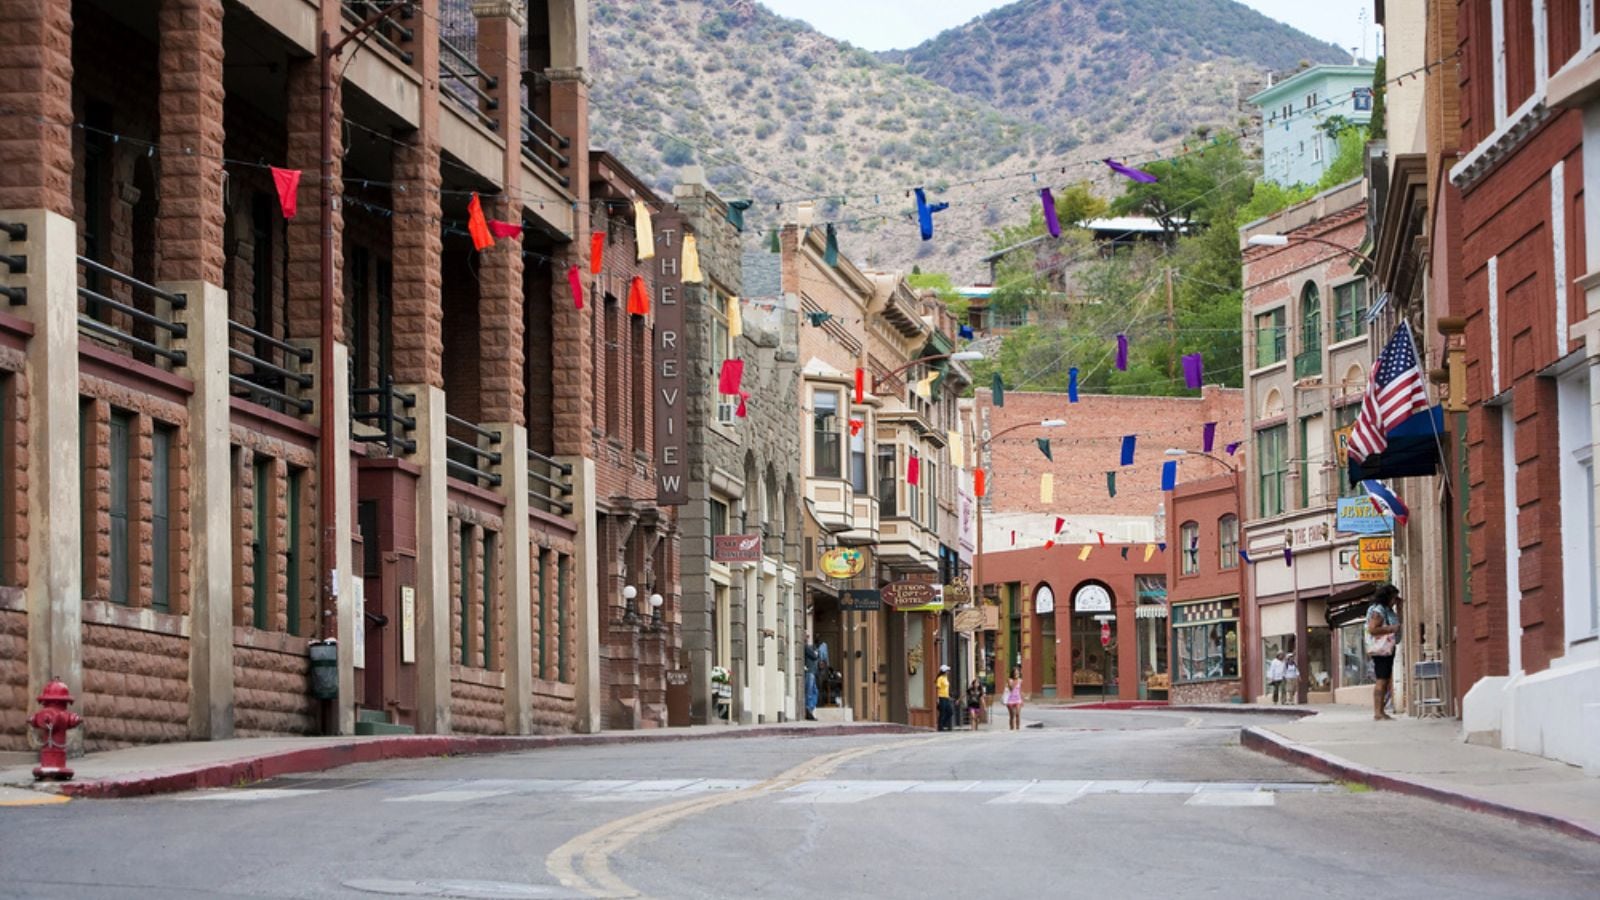
Image Credit: Deposit Photos.
Arizona’s ranking is influenced heavily by its population structure. A large number of retirees means fewer people are actively working, which reduces participation rates.
Tourism and service industries also shape the data. Many roles in these sectors are part-time or seasonal, which lowers average weekly hours.
The combination of these factors creates a clear pattern. Population age and job type both play a strong role in how much work is recorded.
4. Nevada

Image Credit: f11photo at Shutterstock.
Nevada relies on hospitality and entertainment, industries that often depend on shift-based and part-time work. This structure lowers average hours even when employment levels are stable.
Tourism adds another variable. Demand rises and falls throughout the year, which affects how much people work in any given period.
This leads to a workforce that is active but not always logging long hours. The nature of the jobs shapes the outcome more than participation alone.
5. Michigan
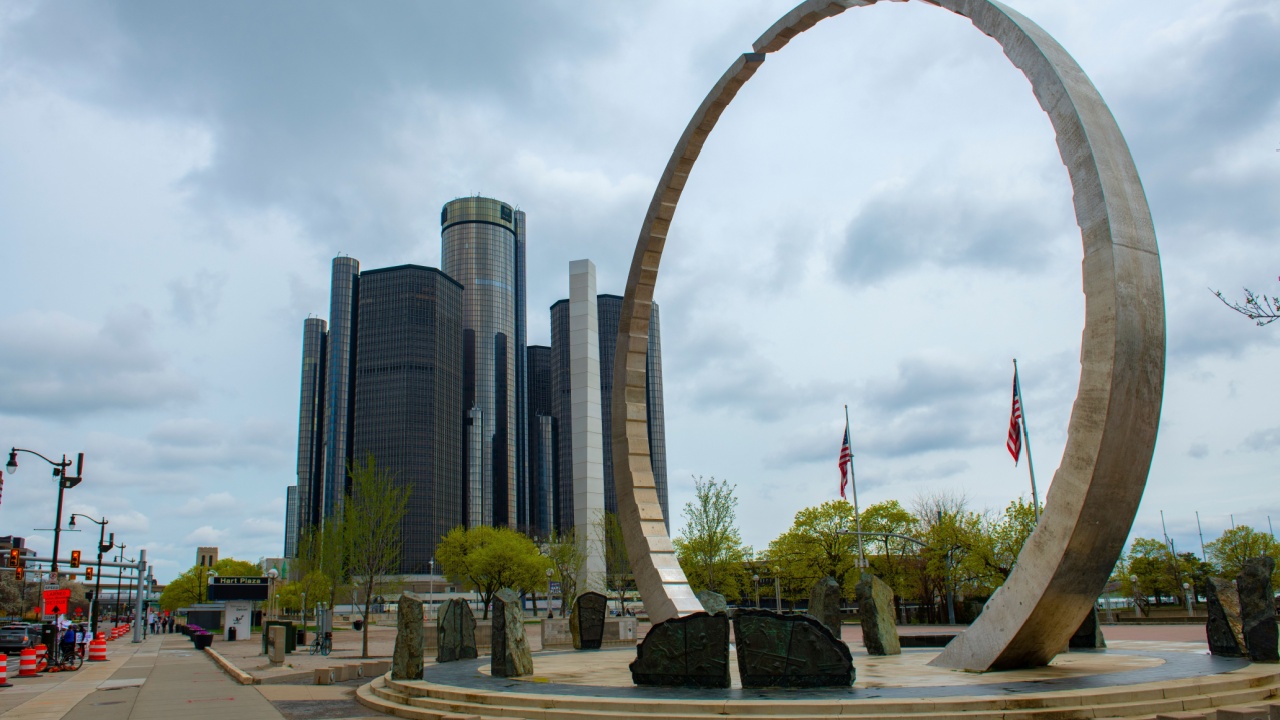
Image Credit: Wangkun Jia at Shutterstock.
Michigan’s ranking reflects long-term industrial changes. Manufacturing remains important, but automation and restructuring have reduced the number of workers needed.
Although recovery efforts have improved employment in some areas, participation rates still lag behind higher-ranked states. This affects both job availability and total hours worked.
The shift toward technology-driven production continues to influence the state’s labor patterns. Fewer workers are needed, even as output remains strong.
6. New York
Image Credit: Deposit Photos.
New York presents a mixed picture. While some industries demand long hours, others operate on shorter schedules, which brings down the overall average.
The state’s size and diversity contribute to uneven patterns. Urban areas may show high activity, while other regions operate at a slower pace.
This variation makes the data more complex. A large workforce does not always translate into longer average hours.
7. California
Image Credit: bluestork at Shutterstock.
California shows a wide variation in how people work. Some sectors require long hours, but many rely on flexible or part-time arrangements, which lowers overall averages.
The gig economy plays a role here. Work is still being done, but it is spread across non-traditional setups that do not always register as full-time employment.
This reflects a broader shift in how work is structured. New models can change how effort appears in official data.
What the Rankings Really Reveal Behind the Numbers

Image Credit: Deposit Photos.
Work patterns across these states come down to industry, population, and economic pressure. States at the top tend to reflect longer hours driven by demand or necessity, while those at the bottom often show structural or demographic limits on participation.
Looking at both sides together gives a clearer sense of how work actually plays out across the country.
Read More:
The 14 Most Stressed States in America
10 States Where Americans Pay the Most and Least for Electricity